RFF ON THE ISSUES: Looking ahead with Exelon; CSAPR authority upheld
Looking Ahead with Exelon
Energy provider Exelon has announced its purchase of Washington-based Pepco, forming a “large electric and gas utility in the Mid-Atlantic region” to service about 10 million customers. On Tuesday, May 13, Exelon CEO and President Chris Crane will join RFF President Phil Sharp for an RFF Policy Leadership Forum to discuss shifting energy trends and landscapes facing today’s utility providers. Tune in for a live webcast of the eventand tweet questions using the hashtag #AskRFF.
CSAPR Authority Upheld
In a 6–2 decision, the Supreme Court has upheld the US Environmental Protection Agency’s authority, under the Cross-State Air Pollution Rule (CSAPR), to regulate air pollution from power plants that affects downwind states. The rule was previously struck down by a lower court after litigation was brought by opponents who call the regulation “costly to the economy.”
Research on CSAPR by RFF’s Dallas Burtraw, Karen Palmer, Anthony Paul, and Matt Woerman reveals that “changes in natural gas supply and electricity demand overwhelm the effects associated with these environmental regulations. . . . Industry, policymakers, and the public will want to carefully separate the effects of these changes when evaluating the economic consequences of pending environmental regulations.” They conclude that CSAPR can be implemented “apparently with little disruption to the sector, especially in comparison with the normal disruptions associated with a changing world.”
Understanding the IPCC: An Important Follow-Up
A week ago, I wrote at this blog about my recent frustrations with the government approval process of one part of the Summary for Policymakers (SPM) of the Intergovernmental Panel on Climate Change (IPCC) Fifth Assessment Report (AR5) Working Group III (WG3) report, namely the section in the Summary for Policymakers (SPM.5.2) on “International Cooperation,” for which I had major responsibility.
In that post, I described how the government approval process, which took place in Berlin in early April, had led to the deletion of a significant fraction of the text of SPM.5.2, not because governments questioned its scientific validity, but because they found various passages to be inconsistent with their respective positions and national interests within the ongoing international climate change negotiations under the United Nations Framework Convention on Climate Change (UNFCCC). (That post took the form of a letter to the co-chairs of WG3 – Ottmar Edenhofer, Ramon Pichs-Madruga, and Youba Sokona. They have since sent a thoughtful response and agreed for me to provide a link to their letter here.)
Why a Follow-Up Post?
My first post has been widely reported in the press. Some of this coverage was accurate and reasonable. Pilita Clark of the Financial Times, in particular, wrote an excellent article that accurately presented my views and conveyed some additional useful insights. Other press coverage, however, inaccurately stated or suggested that my critique of the IPCC process was much broader than it was. This was despite my very careful caveats in the first blog post, in which I tried hard to communicate clearly the limited focus of my critique, namely the effects of the government approval process on one section (SPM.5.2) of the Summary for Policymakers.
This Week in the RFF Library Blog
Each week, we review the papers, studies, reports, and briefings posted at the “indispensable” RFF Library Blog, curated by RFF Librarian Chris Clotworthy. Check out this week’s highlights below:
Annual Energy Outlook Projections and the Future of Solar PV Electricity
The Economist recently declared that due to technological advancements in solar photovoltaic (PV) energy, soon “alternative energy will no longer be alternative.” But this transition to a solar energy future in the United States is rife with uncertainty. Will costs continue to fall at their recent pace? Can solar compete everywhere, or only when and where the sun shines brightest? — via New York University
The Arctic in the Anthropocene: Emerging Research Questions
Once ice-bound, difficult to access, and largely ignored by the rest of the world, the Arctic is now front and center in the midst of many important questions facing the world today. Our daily weather, what we eat, and coastal flooding are all interconnected with the future of the Arctic. The year 2012 was an astounding year for Arctic change. The summer sea ice volume smashed previous records, losing approximately 75 percent of its value since 1980 and half of its areal coverage. Multiple records were also broken when 97 percent of Greenland’s surface… — via National Research Council
Efficiency Concerns Top Two New Energy Polls
Four out of five American consumers and energy professionals view energy efficiency as a personal priority and at least two out of three believe it could significantly reduce overall energy use if not for political squabbling, two new surveys show…Findings from the separate surveys, conducted this spring by The University of Texas at Austin and the nonprofit OurEnergyPolicy.org, were released Wednesday morning during an event at the National Press Club… — via University of Texas
Resources Magazine: Groundwater Markets - Managing a Critical, Hidden Resource
Nearly all our usable freshwater comes from groundwater, so why is it mostly unregulated in the United States? Yusuke Kuwayama describes a market-based solution to better manage our nation’s depleted aquifers.
As California’s three-year drought rages on, some communities are on the verge of running out of water. Ranchers are being forced to sell off cattle in fire sales, and the governor has urged residents to cut their water use by 20 percent. The California State Water Project—which has been pumping water from northern California to the arid southern end of the state since the 1960s—announced that for the first time, it would provide no supplemental water to the 25 million Californians and about 750,000 acres of irrigated farmland it normally serves. Instead, these customers will have to rely solely on local sources of water. The situation presents a catch-22 for the state and its residents: water shortages will increase reliance on declining groundwater supplies, but the unsustainable use of this resource has contributed to the severity of the drought.
While extreme, the current drought in California demonstrates the importance of effective water resource management, including the prudent use of critical groundwater resources. Groundwater use is typically unmonitored and unregulated in the United States. Many states allow anyone to drill a new groundwater well, while a few western states have a priority system that ranks pumpers based on when they started pumping from the aquifer. In Texas, the law governing groundwater use is known as the “rule of capture,” which allows a person the right to pump whatever groundwater is available. California follows the “reasonable use doctrine,” which allows a user to pump an infinite quantity of water as long as the water is put to a “beneficial use.” While this prevents many wasteful uses of groundwater, it allows continued pumping even if water tables decline in the underlying aquifer or if flows are reduced in connected streams and rivers.
The Consequences of Unregulated Pumping
On one hand, the lack of attention from policymakers and the general public is not surprising. Groundwater is located beneath the earth’s surface in gaps between particles and chunks of soil, as well as spaces in the fractures of rock formations, so it’s not immediately visible to us on a daily basis. On the other hand, groundwater is our most important freshwater resource, accounting for 95 percent of our usable freshwater, compared to 3.5 percent contained in lakes, swamps, reservoirs, and rivers.
Substantial pumping has resulted in large water table declines and the depletion of water stored in aquifers, requiring users to deepen their wells to reach increasingly scarce supplies or even shut down productive activities that rely on groundwater. In the Ogallala aquifer underneath the Great Plains, for example, pumping for irrigation since the 1940s has led to declines so large that the aquifer no longer supports irrigated agriculture in vast stretches of Texas and Kansas. According to a 2013 US Geological Survey study, about 32 percent of the depletion of this aquifer since the start of the twentieth century took place between 2001 and 2008.
Read the rest of this article.
Deep and Shallow Uncertainty in Messaging Climate Change
This post draws on a recent RFF discussion paper by RFF Senior Fellow Roger Cooke, where he explores these topics in greater detail. Cooke is the Chauncey Starr Chair in Risk Analysis at RFF and lead author for Risk and Uncertainty in the recently released IPCC Fifth Assessment Report.
Present State of the Uncertainty Narrative
In 2010, the US National Research Council (NRC) illustrated reasoning under uncertainty about climate change using the calibrated uncertainty language of the 2005 Intergovernmental Panel on Climate Change (IPCC) Fourth Assessment Report. The NRC report bases its first summary conclusion on “high confidence” (at least 8 out of 10) or “very high confidence” (at least 9 out of 10) in six (paraphrased) statements:
- Earth is warming.
- Most of the warming over the last several decades can be attributed to human activities.
- Natural climate variability … cannot explain or offset the long-term warming trend.
- Global warming is closely associated with a broad spectrum of other changes.
- Human-induced climate change and its impacts will continue for many decades.
- The ultimate magnitude of climate change and the severity of its impacts depend strongly on the actions that human societies take to respond to these risks.
What is the confidence that all these statements hold? In the non-formalized natural language it is not even clear whether “all statements have a 0.8 chance of being true” means “each statement has a 0.8 chance of being true” or “there is a 0.8 chance that all statements are true.” Consider the second statement. Are the authors highly confident that “the earth is warming AND humans are responsible”, or are they highly confident that “GIVEN that the earth is warming, humans are responsible”? These are very different statements. Since the Earth’s warming is asserted in the first statement, perhaps the second statement is meant. In that case, the likelihood of both statements holding is the product of their individual likelihoods. If the first two statements enjoy “high confidence”, then both can hold with only “medium confidence”.
Suppose the Nuclear Regulatory Commission licensed nuclear reactors based on the finding that each reactor’s safety each year was “virtually certain” (99–100 percent probability). With 100 commercial nuclear reactors, each with a probability of 0.01 per year of a meltdown . . . well, do the math. That is the point: To reason under uncertainty you may have to do math. You can’t do it by the seat of the pants. I am very highly confident that all above statements hold, but I am 100 percent certain that this way of messaging uncertainty in climate change won’t help us get the uncertainty narrative right.
This Week in the RFF Library Blog
Each week, we review the papers, studies, reports, and briefings posted at the “indispensable” RFF Library Blog, curated by RFF Librarian Chris Clotworthy. Check out this week’s highlights below:
The 2014 Fuels America Economic Impact Study: Methodology
A new industry report released today shows how the Renewable Fuel Standard (RFS) is creating jobs and significant economic impact. The Fuels America coalition released an economic impact study by John Dunham & Associates showing that the industry supports more than 850,000 American jobs and drives $184.5 billion of economic output. — via John Dunham & Assoc. for Fuels America
Hydraulic Fracturing: Meeting the Nation’s Energy Needs While Protecting Groundwater Resources
In the NGWA’s position paper, Hydraulic Fracturing: Meeting the Nation’s Energy Needs While Protecting Groundwater Resources, the Association discusses that poor water quality may not be a direct result from fracking. The study shows that water contamination and other drinking water and/or groundwater issues are instead the result of faulty casing installations, unsealed wells, poor management, accidents, and other instances where unsatisfactory practices or processes take place. — via National Groundwater Association
Draft California Communities Environmental Screening Tool v2.0 (CalEnviroScreen 2.0)
…The screening tool, called CalEnviroScreen, was developed by the Office of Environmental Health Hazard Assessment, a branch of Cal/EPA, to pinpoint the communities with the highest exposure and vulnerability to multiple environmental hazards, including polluted air and water, waste facilities and contaminated soil… — via California Environmental Protection Agency
RFF ON THE ISSUES: Droughts and groundwater; North American energy
Droughts and Groundwater
Lawmakers in California recently proposed the nation’s first water efficiency standards for new toilets and faucets, which are expected to save the state 8.2 billion gallons of water in the first year. The standards should help relieve pressure on water providers in what is expected to be “a hot and dry future for the state.”
California’s drought “presents a catch-22 for the state and its residents,” writes RFF Fellow Yusuke Kuwayama in an article for Resources magazine. “Water shortages will increase reliance on declining groundwater supplies, but the unsustainable use of this resource has contributed to the severity of the drought.” He suggests that the creation of groundwater markets could serve the state’s “changing conditions and demands” while preventing large declines in water tables.
Is the IPCC Government Approval Process Broken?
This post originally appeared on Robert Stavins’s blog, An Economic View of the Environment.
Over the past 5 years, I have dedicated an immense amount of time and effort to serving as the Co-Coordinating Lead Author (CLA) of Chapter 13, “International Cooperation: Agreements and Instruments,” of Working Group III (Mitigation) of the Fifth Assessment Report (AR5) of the Intergovernmental Panel on Climate Change (IPCC). It has been an intense and exceptionally time-consuming process, which recently culminated in a grueling week spent in Berlin, Germany, April 5-13, 2014, at the government approval sessions, in which some 195 country delegations discussed, revised, and ultimately approved (line-by-line) the “Summary for Policymakers” (SPM), which condenses more than 2,000 pages of text from 15 chapters into an SPM document of 33 pages. Several of the CLAs present with me in Berlin commented that given the nature and outcome of the week, the resulting document should probably be called the Summary by Policymakers, rather than the Summary for Policymakers.
Before returning to the topic of today’s blog entry — the SPM process and outcome — I want to emphasize that the IPCC’s Working Group III “Technical Summary” and the underlying Working Group III report of 15 chapters were completely untouched by the government approval process of the Summary for Policymakers. So, the crucial IPCC products – the Technical Summary and the 15 chapters of WG 3 – retain their full scientific integrity, and they merit serious public attention. Now, back to the SPM process and outcome…
Research Questions for the Midterm CAFE Review: Will the Footprint-Based CAFE Standard Work as Expected?
This is the third in a series of blog posts by RFF’s transportation team that addresses some of the key research questions for the midterm CAFE review.

Source: iStockphoto
The first two blog posts in this series introduced the midterm review of the corporate average fuel economy (CAFE) standards and discussed unresolved issues for this review about the fuel efficiency gap. In this post, we focus on issues raised by the shift to vehicle footprint–based standards. Until the changes to the CAFE rules in 2012, all passenger cars were held to the same fuel economy standard (27.5 miles per gallon [mpg] from 1990 to 2011) and all light-duty trucks were held to a weaker standard (between 20 and 23 mpg during the same period). But before the standards were tightened in 2012, federal legislation in the late 2000s required the ruling agencies to base the new standards on a vehicle attribute or attributes related to fuel economy (known as attribute-based standards). The US Environmental Protection Agency and National Highway Traffic Safety Administration (NHTSA) now base the standards on a vehicle’s footprint, defined as the area between the four wheels, and they also maintain the car–truck distinction. Vehicles with a smaller footprint must meet a tighter standard than those with a larger footprint, and light-duty trucks still have a less stringent overall footprint standard than cars.
Before making this decision, the agencies considered several attributes on which to base the standards. European, Japanese, and Chinese standards depend on vehicle weight, with heavier vehicles allowed to have more lenient standards. One argument for the footprint standard used in the United States over the weight-based standard is that it would provide incentives for manufacturers to improve fuel economy by using lighter-weight materials. A weight-based standard would not provide the same incentive, because lighter vehicles would face a tighter standard. The agencies also argued that a footprint standard would force more technology for improved fuel economy across all vehicle sizes, with less incentive to downsize to meet the standard. Whether based on size or weight, the attribute-based standard has political appeal because it will have costs that fall more evenly on all manufacturers compared to a mpg-based standard that would tend to favor manufacturers with a smaller or lighter vehicle fleet. An attribute-based standard was also especially appealing to NHTSA, who was particularly concerned that, with so many large vehicles on the roads, downsizing new vehicles would result in more fatalities.
But will the footprint standard work as expected? The effect of CAFE standards on traffic fatalities is highly controversial. Bigger and heavier vehicles are safer in single-vehicle accidents and are safer for their own occupants in multi-vehicle crashes. But drivers and passengers face greater risk in an accident with a larger or heavier vehicle than with a smaller or lighter one. Furthermore, NHTSA analysis recently concluded that reducing weight while holding footprint constant does not increase fatality risks; this is a major reason the agency favors the footprint-based standard. Read More
Flood Insurance Claims: A Fat Tail Getting Fatter
Floods remain some of the worst disasters around the world. They cause more property damage and insured losses than many other types of events. In the US, floods are primarily insured through the federally-run National Flood Insurance Program (NFIP). This program has been making the headlines recently as Congress tries to address the program’s massive debt from Hurricanes Katrina, Ike, and Sandy; homeowners bemoan high flood insurance costs; communities receive new flood maps suggesting flood risk has changed over time; and disaster victims wonder how to rebuild to prevent future losses and keep insurance costs manageable.
We have been examining the distribution of NFIP claims, provided by the Federal Emergency Management Agency to the Wharton Risk Center. Individual claims are aggregated to census tracts and months, over the years 1978 to 2012. We find that this distribution is decidedly fat-tailed. This means that yearly losses can be hopelessly volatile and, as such, historical averages are not good predictors of future losses. For those more technically inclined, we have been doing this by fitting a Pareto distribution to the aggregate claims. Our estimation of the tail index gives an indication of the fatness of the tail. The smaller the tail index, the fatter the tail.
That flood claims are fat-tailed is, in and of itself, not so surprising. Many disaster losses have been found to exhibit fat tails. What is concerning, however, is that the tail of flood insurance claims seems to be getting fatter over the time period in our data. This would indicate the extremes are getting even more extreme. One way to examine this is to use the so-called Hill estimator, which gives an estimate of the tail index (here, based on the largest 10% of claims), for each year. When we plot estimates of the tail index using this method, there is a clear downward trend, as seen in the figure below. Lower values, fatter tail. The blue diamonds are the yearly estimates and the black line is a fitted linear trend line to those estimates.
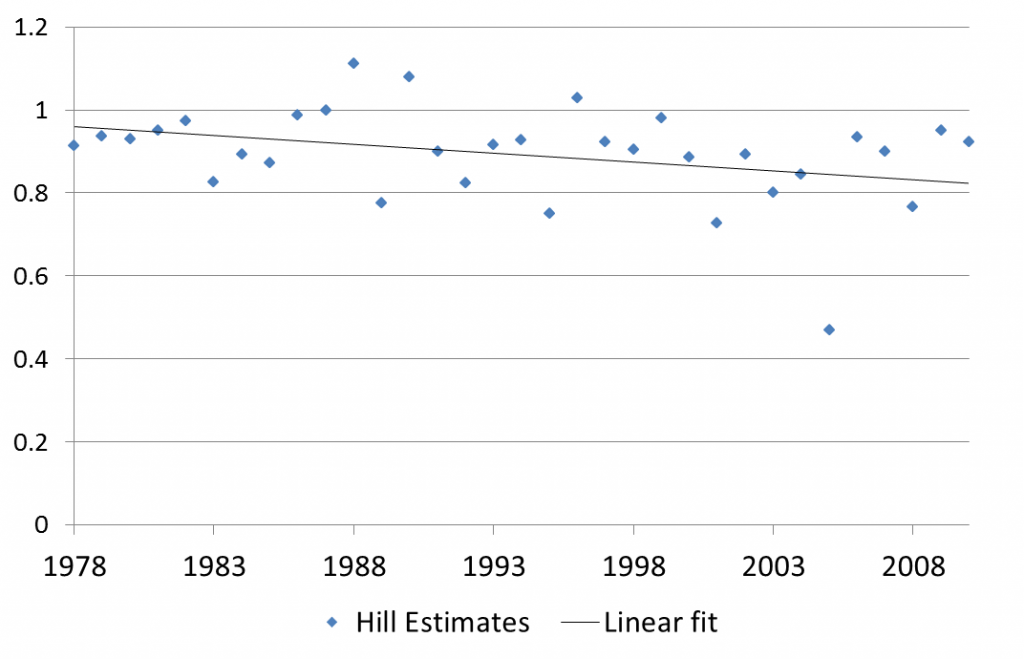
We also looked at the tail index by state. We broke the data into two periods, 1978-1990 and 1990-2012, and estimated the tail index (using maximum likelihood) for each period for each state in the country. For all but a handful, the tail index is lower in the later period, indicating that the tail of the distribution of flood claims is fatter in the later period.
 Subscribe; to our RSS Feed
Recent Comments